Technical Challenge
Mixing small volumes (microliters or milliliters) of reagents is a common step in many biological and chemical assays and processes. A simple way of performing this mixing is by repetitive pipetting: repeatedly dispensing and withdrawing solution from a microwell or tube. This process is repeated until the solutions are sufficiently mixed. The number of cycles required to achieve a desired level of mixing depends on the microwell and pipette geometries, the reagents (chemicals), and the flow rate vs. time profile. Understanding the effects of these features on mixing is essential to designing effective mixing protocols.
Veryst Solution
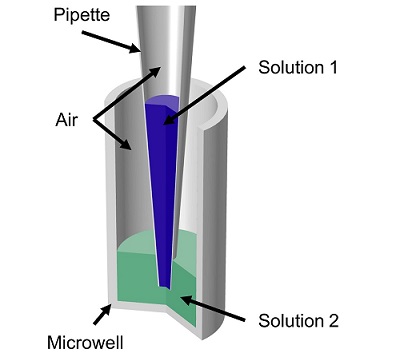
Veryst used COMSOL Multiphysics to simulate fluid flow and mass transfer of the mixing of two aqueous solutions by repetitive pipetting in a model axisymmetric pipette and microwell geometry (Figure 1). The pipette initially contained 20 μL of one solution and the microwell initially contained 60 μL of a second solution. The flow rate profile involved first withdrawing solution from the microwell and then repeatedly dispensing and withdrawing a “cycled volume” to/from the microwell. We tested both slow and fast flow rates (100 μL/s and 200 μL/s) and small and large cycled volumes (20 μL and 55 μL).
For this demonstration model, we assumed that both aqueous solutions have the same density and viscosity. Our COMSOL model uses a moving mesh formulation to represent the moving air/liquid interfaces.
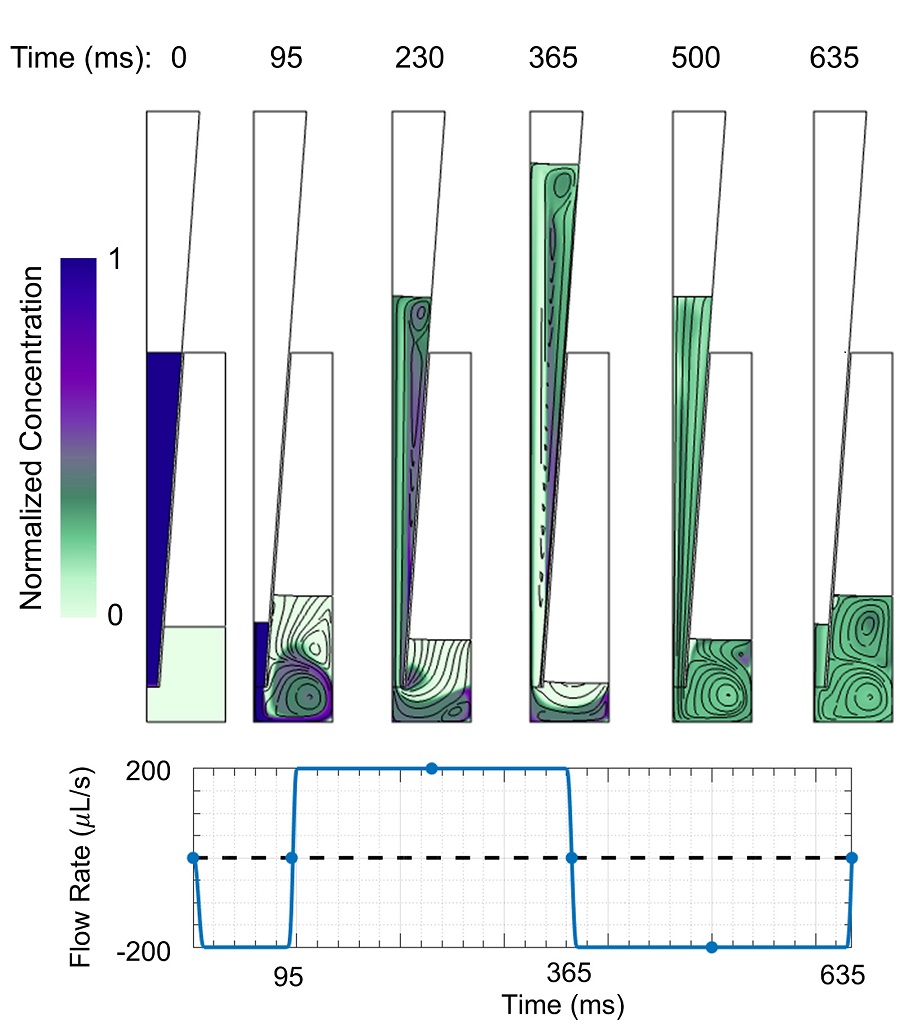
An animation of mixing with fast flow rate and large cycled volume is shown in Figure 2. The two solutions are mostly mixed within one cycle, although some regions take longer to mix. Figure 3 shows streamlines and concentrations at different times during the initial withdrawal step and first dispense/withdrawal cycle.
The Peclet number, which is the ratio of chemical transport by the flow (advection) to transport by diffusion, is greater than 105 for both flow rates. Thus, transport is dominated by the flow and other sources of agitation are not required to achieve sufficient mixing.
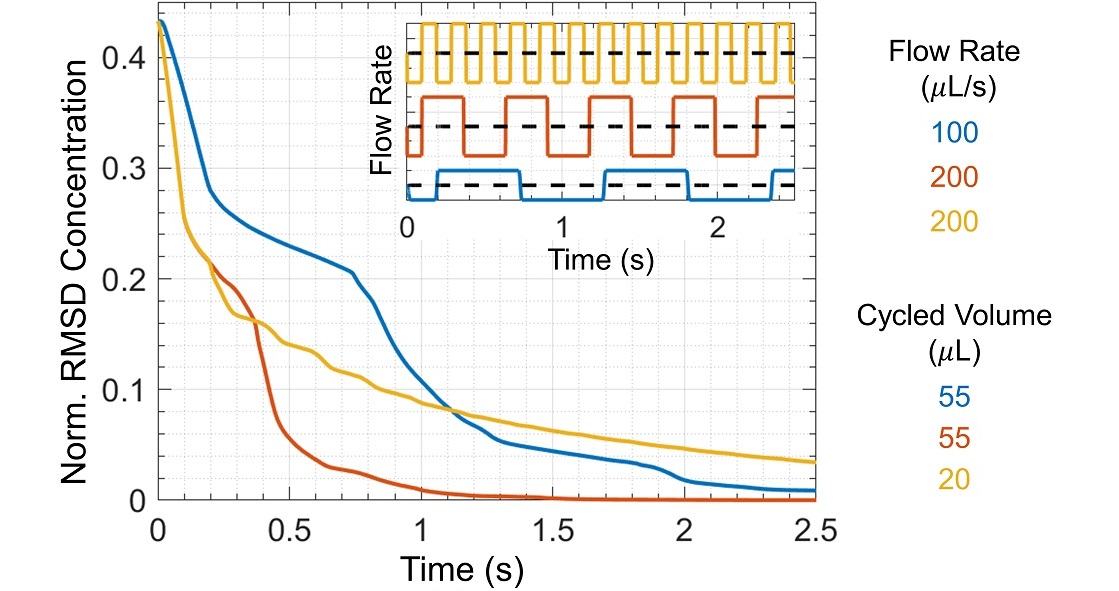
One measure of mixing efficiency is the root-mean-square deviation (RMSD) in concentration, which we calculated from simulation output for three mixing protocols comprising combinations of the two flow rates and two cycled volumes (Figure 4). The RMSD concentration decreases more quickly for faster flow rates because the Reynolds number is larger. The Reynolds number is the ratio of inertial forces to viscous forces, Re = velocity × length scale / kinematic viscosity, where the characteristic length scale is the pipette tip diameter. For flow rates 100 μL/s and 200 μL/s, the corresponding Reynolds numbers are 185 and 370, respectively. As Re increases, the fluid experiences greater inertial forces, greater flow asymmetry between dispensing and withdrawal, and therefore increased mixing per cycle.
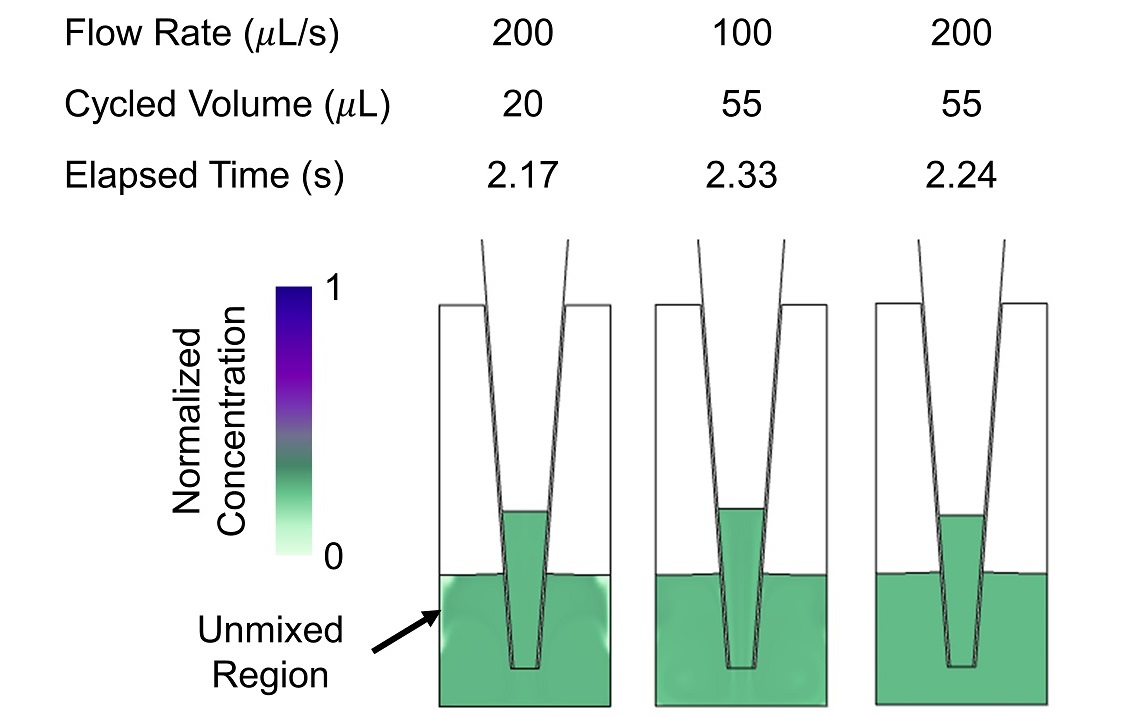
Mixing is also more efficient with larger cycled volumes. When the cycled volume is too small, unmixed regions remain for many dispense/withdraw cycles, even at large Reynolds numbers (Figure 5). More complex protocols with optimized flow rates and pumped volumes could be simulated to find mixing protocols with improved mixing in less time. Additionally, more complicated flow patterns resulting from changes in well shape or pipette tip placement, e.g. swirl flow, could be introduced to improve mixing efficiency.
Conclusion
Veryst was able to test and compare microwell mixing protocols using COMSOL Multiphysics simulations to model the fluid mechanics and mass transport in a pipette microwell system. Simulations such as these may be used to design and optimize mixing protocols in a wide range of biological and chemical assays and processes.