Technical Challenge
Measuring the fracture toughness of adhesive joints under impact is important for understanding the performance of adhesively bonded structures in numerous industries. Predicting the crashworthiness of bonded automotive structures and the drop-resistance of hand held electronics are just two examples.
However, getting a good measure of toughness at impact rates can be difficult due to the dynamic nature of the experiments.
Veryst Solution
Veryst developed a new test method for measuring Mode I joint toughness under impact loading that does not require measurement of load or crack length. Instead, the method uses substrate beam deflections measured by digital image correlation (DIC) to calculate toughness.
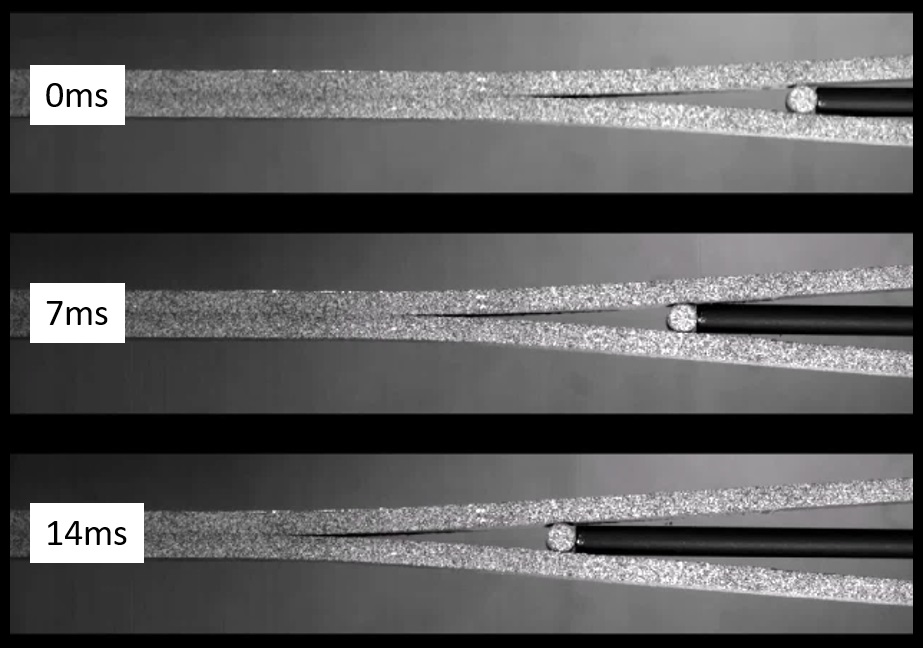
During these experiments, we drive a wedge into a double cantilever beam specimen at several meters per second. Using high speed video and digital image correlation, we record the beam deflections during the test and, from that data, calculate the J-integral as a function of time. We also use DIC to measure the strain rate applied to the adhesive material at the crack tip. Figure 1 gives a snapshot of the experiment. The bonded beams and loading pin have been painted with a speckle pattern to facilitate DIC.
Using this technique, we measured the rate-dependent Mode I fracture toughness of a structural adhesive joint over more than 5 orders of magnitude of crack-tip strain rate. Figure 2 shows applied J as a function of normalized test time for a structural adhesive measured at 3 crack tip strain rates ( έ ).
The highest-rate data was collected using the new test method described above. The two low rate curves were measured on a screw-driven load frame using industry-standard methods.
In all cases, a consistent J-plateau was achieved, giving a measure of the fracture toughness, JIC, of the bonded joint. The average value of JIC for each test is marked by a dashed line in Figure 2.
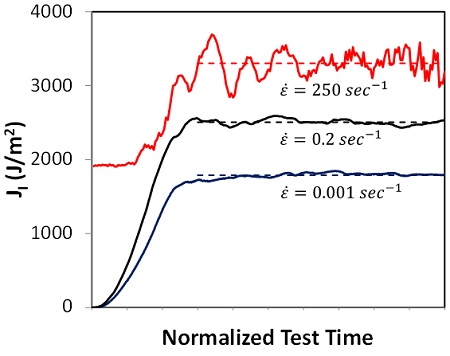
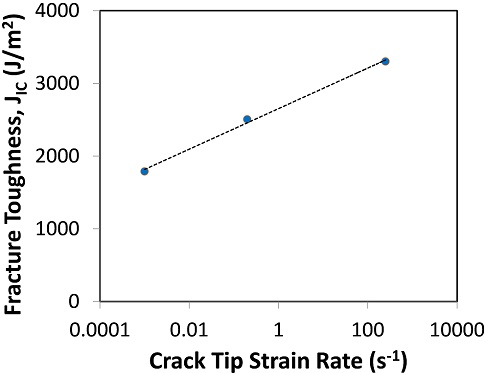
Figure 3 presents the dependence of joint fracture toughness, JIC, on the crack tip strain rate. For this particular adhesive, the toughness increased logarithmically over the range of strain rates tested.
This type of data can be used both to understand the mechanical properties of adhesives and to calibrate cohesive zone models for sophisticated, nonlinear finite element simulations of adhesive joint failure.