Technical Challenge
Arrays of impinging fluid jets are an effective solution for systems that require large heat or mass transfer rates. Examples of applications that leverage impinging jet heat transfer include electronics component cooling, turbine vane and combustor liner thermal management, and material-forming processes and heat treatment.
The complex flow physics of jet arrays, including anisotropic turbulence, jet-to-jet interaction, and crossflow effects, make meeting design objectives such as peak heat transfer distribution or uniformity a challenge. Furthermore, published correlations provide only limited accuracy and are insufficient when considering detailed local heat transfer characteristics.
Veryst Solution
The computational fluid dynamics (CFD) experts at Veryst used Ansys Fluent to simulate the heat transfer from an array of linearly stretched jets (see Figure 1). The example CFD model shown here is based on an experimental test rig(1) to demonstrate the influence of non-uniform jet spacing in a confined array. The flow conditions produce a jet Reynolds number equal to 6,000 and the jet diameter-to-channel height ratio, Z/d, is equal to 3. The target plate in the model is maintained at a fixed temperature of 35°C.
The jet Reynolds number indicates that the flow in this example is fully turbulent, which we model using the Shear Stress Transport (SST) turbulence model. This Reynolds-Averaged Navier-Stokes (RANS) turbulence model offers a reasonable compromise between solution speed and accuracy and has demonstrated an ability to predict average Nusselt number distributions within 5-10% for jet arrays. As is typical in confined jet arrays, the jets in this configuration oscillate, and so the results presented below are taken from time-averaged results of an unsteady simulation.
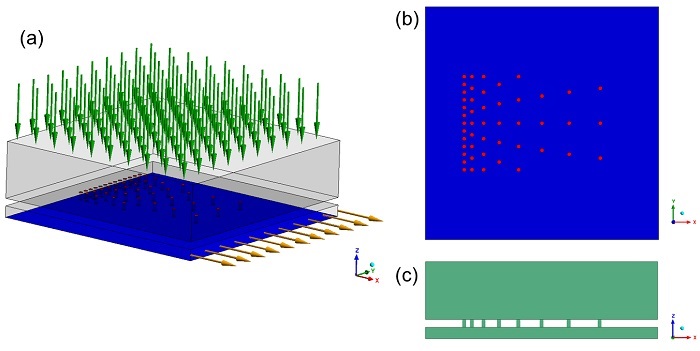
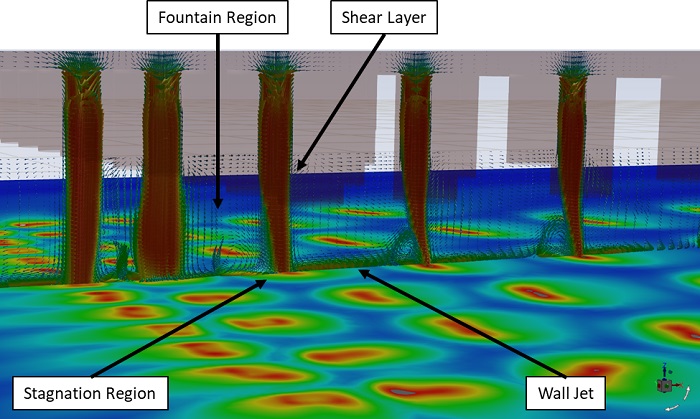
Figure 2 shows velocity vectors on a vertical cut plane superimposed over the heat transfer coefficient distribution on the target plate.
Critical features of the flow field are highlighted: a shear layer develops as the jet exits the orifice plate in the center of the plot. The jet spreads and eventually impinges on the target plate, creating a stagnation region and local peak in heat transfer rate. The flow turns sharply, interacting with the upstream jet to create a fountain region and creating a wall jet in the downstream direction. Moving towards the outlet, the crossflow from upstream jets causes the downstream jets to deflect. This reduces the local peak heat transfer rate and spreads out the impingement region.
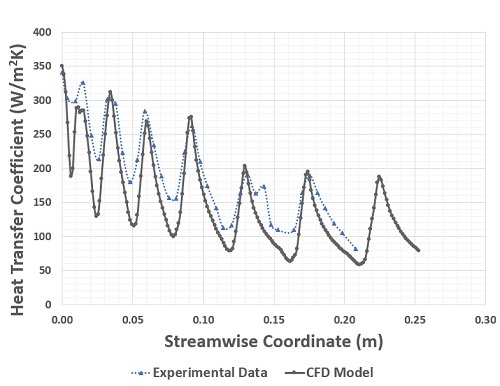
The span-averaged heat transfer coefficient is plotted in Figure 3 and can be used as a measure of the uniformity of heat transfer on the target plate.
The model for the baseline configuration shows good agreement with the experimental data, accurately capturing the peak locations under the jets. The model underpredicts the local minimum regions between jets, which may be due to the assumption that the target plate is isothermal.
The stretched array configuration here produces a heat transfer coefficient distribution that would be useful for cooling a local hot spot, for example in a combustor liner or turbine vane.
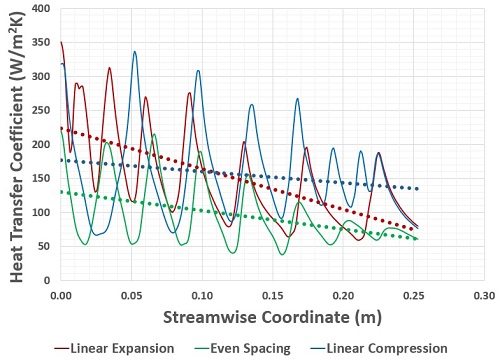
In other applications, such as metal heat treatment, a more uniform heat transfer distribution may be desired. Figure 4 shows the average heat transfer coefficient distribution produced by evenly spaced jets (green) and a linearly stretched configuration that compresses the spacing between holes in the streamwise direction (dark blue). The linear compression configuration demonstrates the ability to achieve more heat transfer uniformity than the other two hole-spacing configurations.
The simple variation of jet distribution patterns shown here demonstrates the ability of Ansys Fluent to predict key flow features and heat transfer distributions of confined jet arrays.
Further studies could include variation of hole diameters, nozzle geometry, and heat transfer augmentation methods made possible by additive manufacturing to help guide jet array configuration to meet design requirements.
(1) L. Gao, S. Ekkad, and R. Bunker. “Impingement Heat Transfer, Part I: Linearly Stretched Arrays of Holes,” Journal of Thermophysics and Heat Transfer, 19 (1): 57-65, 2005