Technical Challenge
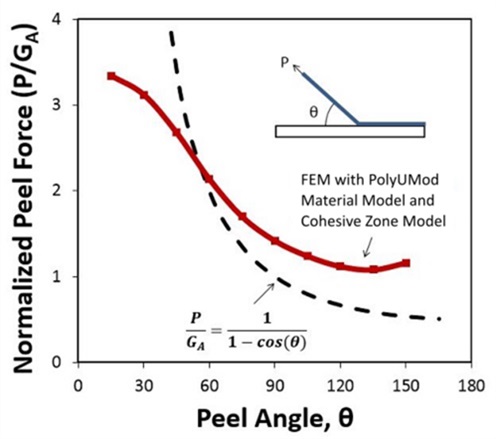
The peel test is widely used to measure the adhesion of thin, compliant films to rigid substrates. An accurate model of the peeling mechanics for the material being tested is required to extract the interface adhesion energy. If the extension of the film during peeling is negligible and the amount of plastic deformation in the film can be ignored, then a simple relationship exists between the peel force per width, P [N/m], the adhesion energy of the interface, GA [J/m2], and the peel angle, θ:
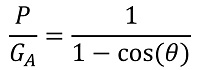
However, this simple expression is not accurate if either large extension of the film or significant plastic deformation of the film occurs during the peeling process, as is the case for soft viscoplastic polymers. These materials require a more sophisticated analysis of the peeling mechanics that accounts for the complex deformation behavior of the material.
Veryst Solution
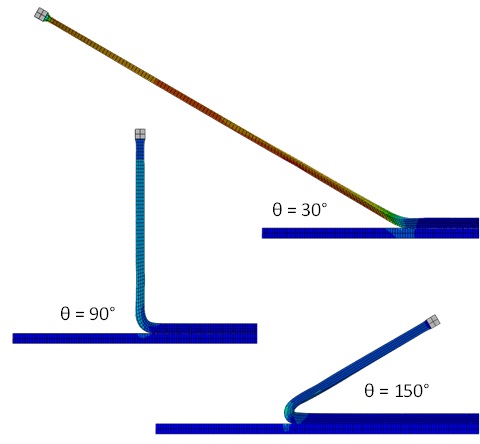
Veryst used the PolyUMod® material model library along with a cohesive zone model of interface adhesion to simulate the peeling of a soft viscoplastic film from a rigid substrate at different peel angles. The deformation of the film during steady-state peeling is shown in Figure 1.
Peeling at small angles involved very large extension of the film, while peeling at large angles involved severe bending and unbending of the film. The predicted dependence of the normalized peel force on peel angle is shown in Figure 2 compared to the simple prediction expressed by Equation 1.
This analysis demonstrates the importance of accounting for the complex deformation behavior of polymer films when analyzing delamination problems. Learn more about how the PolyUMod material model library (originally developed by Veryst) can assist in this effort.