Technical Challenge
Polymers are often used in products subject to impact, with designers reducing a part’s thickness to address weight and cost. Finite element (FE) simulations of drop events can help identify failures but depend on accurate and advanced testing and material modeling. Incomplete material test data can lead to incorrect results from the impact simulations, resulting in failure of the finished part or in qualification.
Veryst Solution
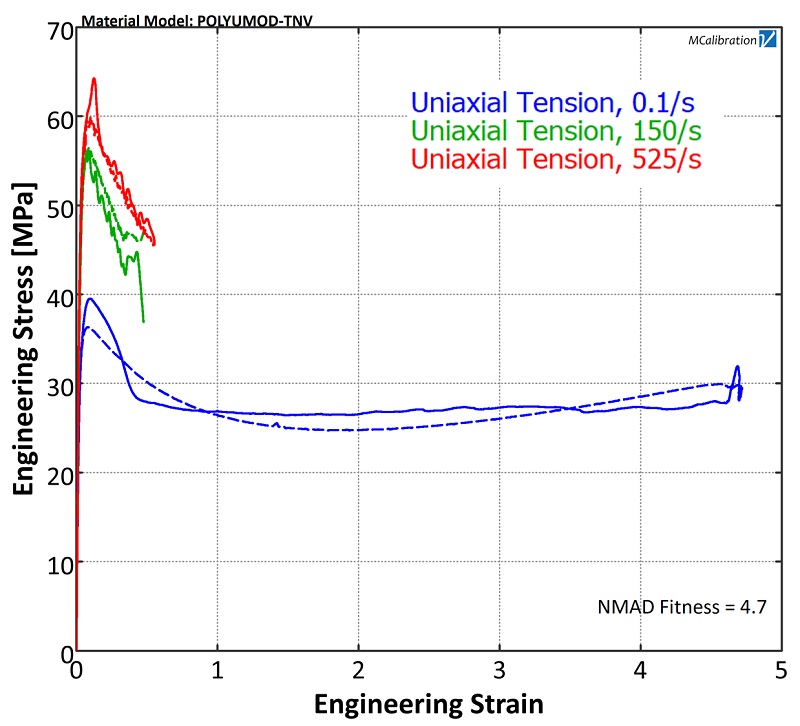
Veryst used its expertise in material testing, impact modeling, and the PolyUMod® user-material model library to simulate the mechanical behavior of the polymers in a bottle pump mechanism. Veryst tested the HDPE (high density polyethylene) material in uniaxial tension at multiple impact rates to calibrate the Three Network Viscoplastic (TNV) material model to the test data. Figure 1 shows the test results (solid lines) and the material model predictions (dashed lines).
Veryst also tested the material with a notched tension test to quantify the pressure-dependent failure of the material. Many polymers exhibit failure strains and stresses that depend on the stress triaxiality at the failure point. Stress triaxiality (η) is defined as
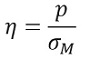
where p is the hydrostatic pressure and σM is the von Mises stress. Figure 2 shows a video of strain contours measured using digital image correlation (DIC) during a uniaxial test.
Figure 3 shows a video of strain contours measured using DIC during a notched tension test.
The notched specimen fails at a significantly lower strain, almost 10% of the failure strain in uniaxial tension. We therefore used the notched tension test data in an inverse calibration to calibrate the failure mode.
Figure 4 presents simulation results for the HDPE failure model at material failure.

The video in Figure 5 shows the impact simulation from Abaqus Explicit that focuses on the pump in the bottle.
We simulated the impact event with two different material models for the HDPE. The first material model used a pressure-independent material model based only on uniaxial data. The second material model included a pressure-dependent failure model.
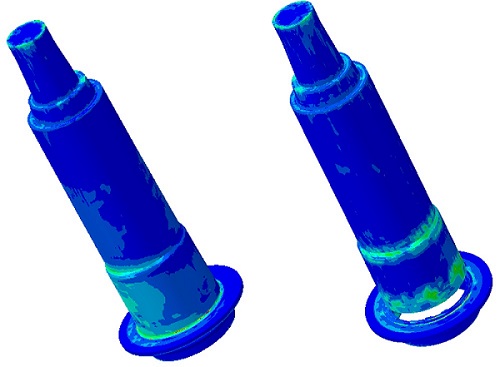
The results for the critical component in the assembly are shown in Figure 6. The left image shows the von Mises stress contours in the part modeled with a pressure-independent failure model. The right image shows the same part with a pressure-dependent failure model. The component failed in this pressure-dependent simulation, matching actual drop test results.
Accurate impact simulations require test data at relevant strain rates. If material failure is possible, the prudent engineer needs to understand that uniaxial failure data may not accurately predict the results. A failure model calibrated with inverse calibrations at different stress triaxialities is necessary when the material exhibits stress-triaxiality dependence.