Technical Challenge
Solvent bonding is a method of joining thermoplastic polymers that can create a fully-sealed interface without adding additional components.
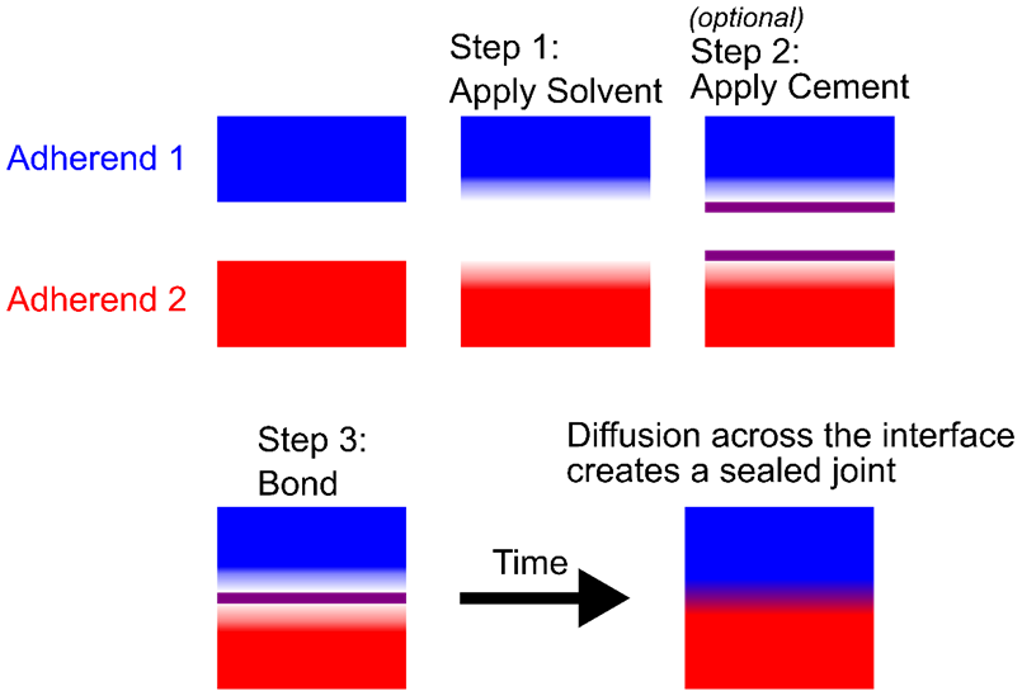
As shown in Figure 1, solvent bonding involves coating the surfaces with a solvent that partially dissolves the polymers at the interface and softens the surfaces. An optional step is to apply a cement containing a polymer dissolved in the solvent to promote adhesion. The two surfaces are then brought into contact, and the swollen polymers diffuse across the interface, creating a bond. The solvent then evaporates over time, leaving behind a joint made from only the thermoplastics themselves.
Solvent bonding is a good choice for joining materials when a full seal is required between two compatible adherends, such as ABS, PVC, or CPVC piping systems.
A high quality solvent bond depends on many process parameters. Too much solvent or using the wrong solvent can significantly weaken the adherends, resulting in both unwanted deformation of the polymers during the bonding process and a weak joint. Temperature also plays a role in solvent bonding: too high a temperature and the volatile solvent evaporates before a bond can be formed; too low and the plastics won’t join properly. The bonding conditions should be optimized to find the right combinations of solvent, temperature, time, and surface preparation that create a strong joint without compromising the strength of the polymers.
Assessing the quality of a solvent bond isn’t always easy. While optical microscopy can be used to assess welding of metals due to the visual markers caused by the heat-affected zone, plastic solvent-bonding does not typically leave behind visible evidence of bond formation. Often, the visible markers that are left behind are misleading and not indications of the joint quality. Therefore, we need to use a different method to analyze the quality of thermoplastic solvent bonding processes and thereby optimize process variables.
Veryst Solution
Using a Fourier-transform infrared (FTIR) microscope, Veryst is able to track the location of individual chemical components of the adherends and obtain a “chemical image” of the solvent-bonded interface. FTIR works by measuring the infrared light absorption properties of molecules, and each molecule has a unique fingerprint of infrared absorption bands. The FTIR microscope collects infrared absorption spectra across the field of view, producing spatially resolved IR spectra.
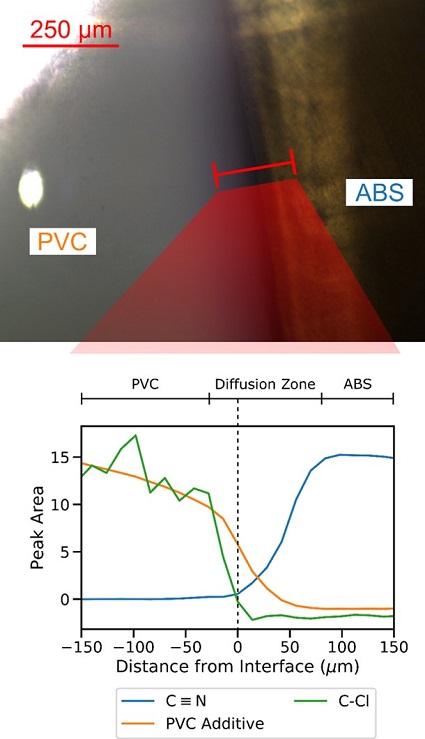
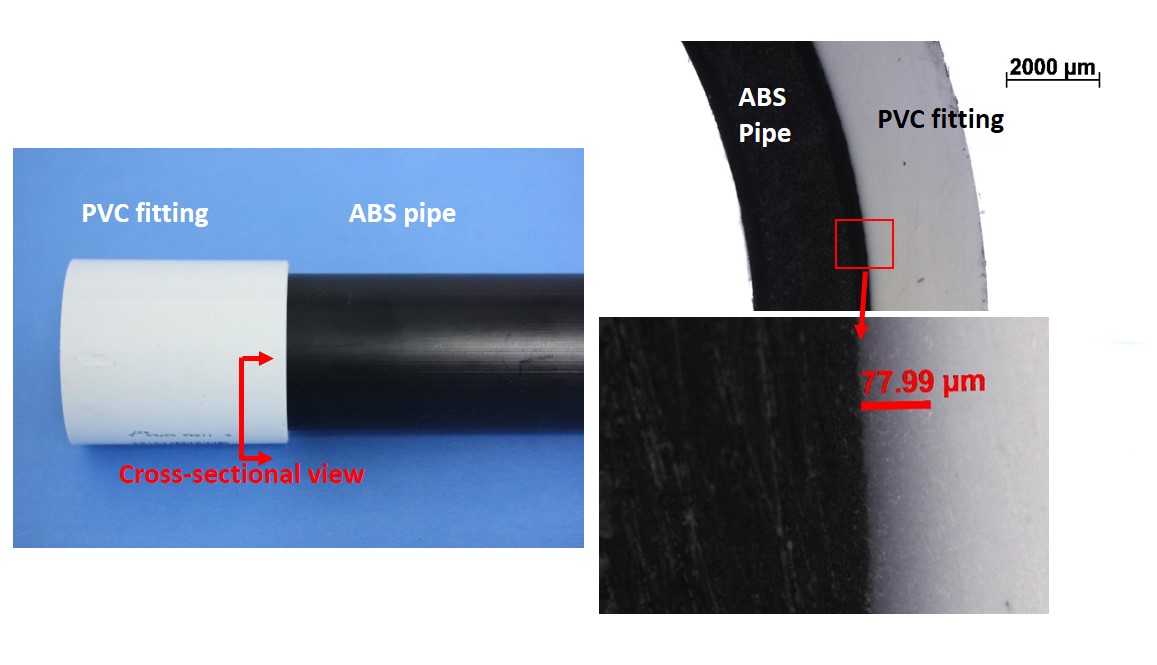
Figures 2- 5 demonstrate this in a solvent-bonded joint between an ABS and a PVC pipe. The optical image shows that a purple dye embedded in the primer solvent travels approximately 80 µm into the PVC. However, the black-colored ABS pipe prevents observation of dye penetration into the ABS. In addition, the dye penetration is an estimate of how far the solvent penetrates PVC, but not an estimate of the width of the interdiffusion zone between ABS and PVC.
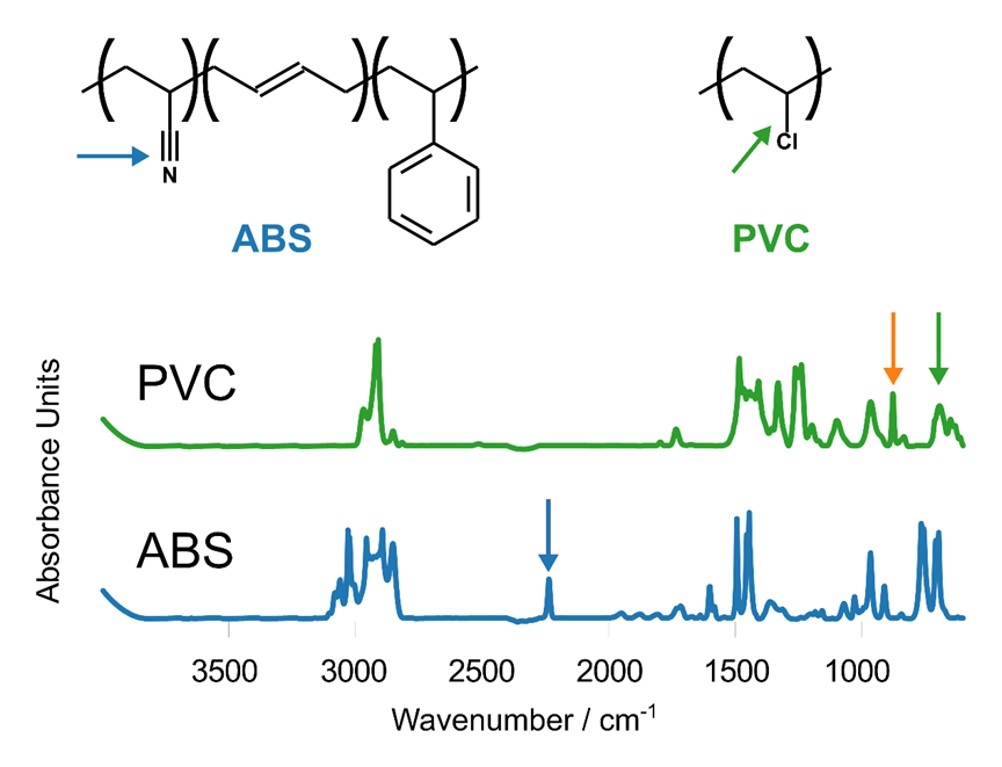
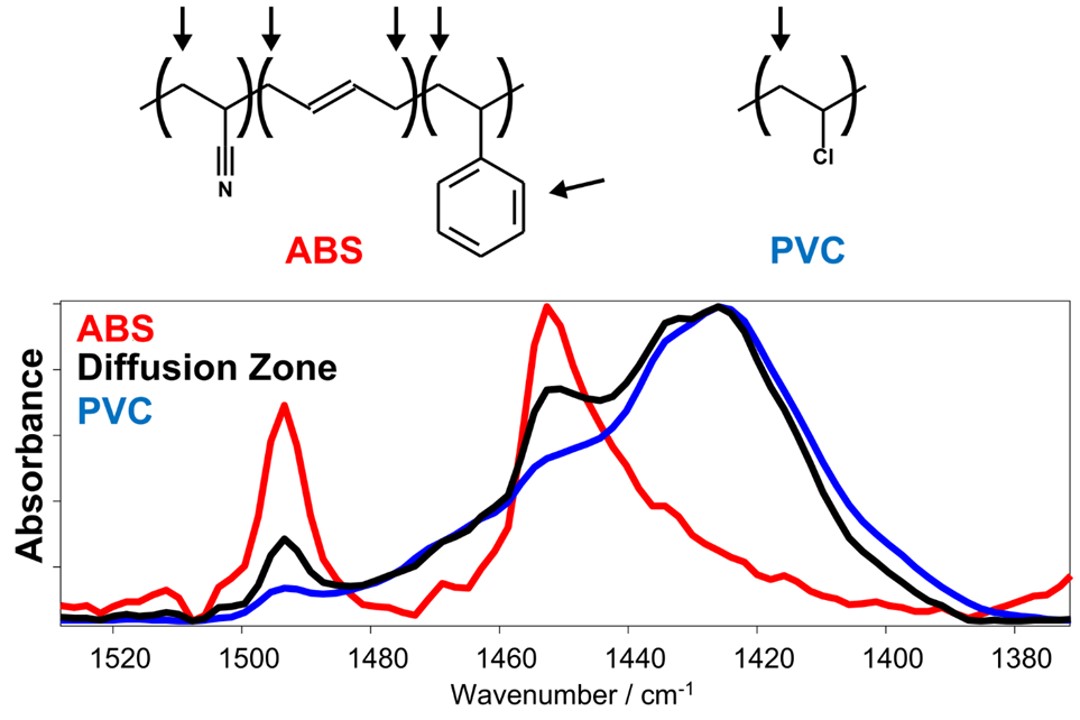
Veryst uses FITR microscopy to measure the material composition across the interface. Figure 3 demonstrates how this works by showing three FTIR spectra taken from the ABS pipe, the PVC pipe, and within the diffusion zone between the two pipes.
PVC has a broad absorption peak at 1425 cm-1, corresponding to CH2 bending. The FTIR spectrum of ABS contains two sharper peaks, one at 1452 cm-1 (CH2 bending) and one centered at 1492 cm-1 (aromatic ring stretching). The spectrum taken within the diffusion zone contains peaks from both ABS and PVC, indicating a mixture of ABS and PVC. PVC and ABS have distinct absorption bands that can be used to estimate the relative concentration of each component. Figure 4 highlights three absorption bands from PVC and ABS: C≡N stretching in ABS (2240 cm-1), C-Cl stretching in PVC (630 cm-1), and a peak from a PVC additive (860 cm-1).
In Figure 5, our analysis demonstrates that while the total width of the diffusion zone is approximately 100 µm, most of the diffusion zone occurs on the ABS side of the interface. However, the PVC additive diffused a longer distance than the PVC molecules themselves. The purple dye, which diffused approximately 78 µm into the PVC side of the joint, is therefore by itself a misleading estimate of the structure of the joint.
An analysis such as FTIR microscopy is required to obtain a more complete understanding of the interdiffusion of the joined polymers and thus the quality of solvent-bonded joints.